Case Studies
From Data to Analysis Quicker than Ever
Issue
Manufacturers need to compare product complaint data against other manufacturers in the market. It is critical to gather and analyze this data quickly in order to better understand areas for product improvement and to ascertain which specific components are receiving the most complaints, versus those products that receive the least number of complaints.
The Datrato Solution
No other website, software or team of personnel has the ability to gather data efficiently for the purpose of getting to actual analysis as quickly as possible. Datrato provides the solution that makes data collection nearly instantaneous, so that users can move on quickly to analyzing differences in performance between two or more manufacturers, or comparing/contrasting the performance of various makes or models for a single manufacturer—all in a simple and intuitive user interface.
Without Datrato, companies would otherwise have to build a complete system from scratch, collect the data from multiple data sources, store the information into a newly built database, develop the necessary tools to process the data, process and compute the data, and develop a delivery mechanism that clearly presents the data—all to get to the point where they are finally analyzing the data. The necessary investment to create this type of process and system from the ground up would be cost-prohibitive—not to mention the ongoing support and maintenance required—so instead many do things the old-fashioned way: pure labor and tedious time investment.
Datum Analysis created Datrato to streamline the process and remove both this prohibitive investment and the alternate laborious “grunt work.”
Results
By providing a system that takes seconds (not days) to gather and present meaningful and complete data, users can get on with the critical work of comparing multiple source complaints between components or manufacturers in virtually any format they need. Datrato clients now spend their valuable time analyzing the data, and minimal time gathering it. The ability to view and customize reports that make visual sense in a greatly reduced timeframe provides precision, reliability, greater manpower efficiency and dramatically reduced financial investment.
Delivery Intelligence
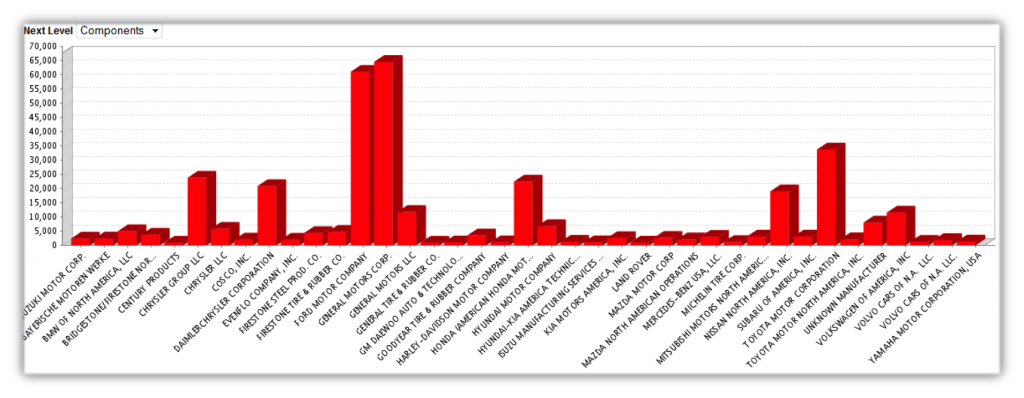
Datrato even includes built-in Graphical Comparison reports, allowing the user to compare the performance of a product against its competitors’ products in an easy-to-read and easily understandable report.

Figure 1: Complaints Comparison Graph
Datrato provides users with the ability to flexibly sort (with the “click of a mouse”) the report for any manufacturer to visually compare data between various makes or components, getting quickly to understanding and intelligence. Users can quickly visualize and analyze which make or model may have the highest volume of issues so they can be addressed in a more timely fashion.
The user also has the ability to look at data from major OEMs, providing the data in an abundance of sortable formats, all with the simplicity and ease of the Datrato interface. Users can look at the data in totality or only for a specific year, make, model and geographic location. Datrato provides the ability to drill down deeply into the data and create reports that provide the level of detail needed to get quickly to intelligence—but more importantly, to solutions.
Data can be downloaded in Excel if more advanced analysis is required, or to merge the data with other internal sources for custom processing. Statistical Data and Analysis Reports are available for Complaints, Recalls, and Investigations.
Multiple Statistical Analysis Reports
Datrato users can view a multitude of statistical analysis reports for any searches performed. Datrato automatically computes the statistical analysis information for each search performed using the advanced logic built into the system.
Following are some examples of the Statistical Analysis Reports available in Datrato.
Proportion Analysis
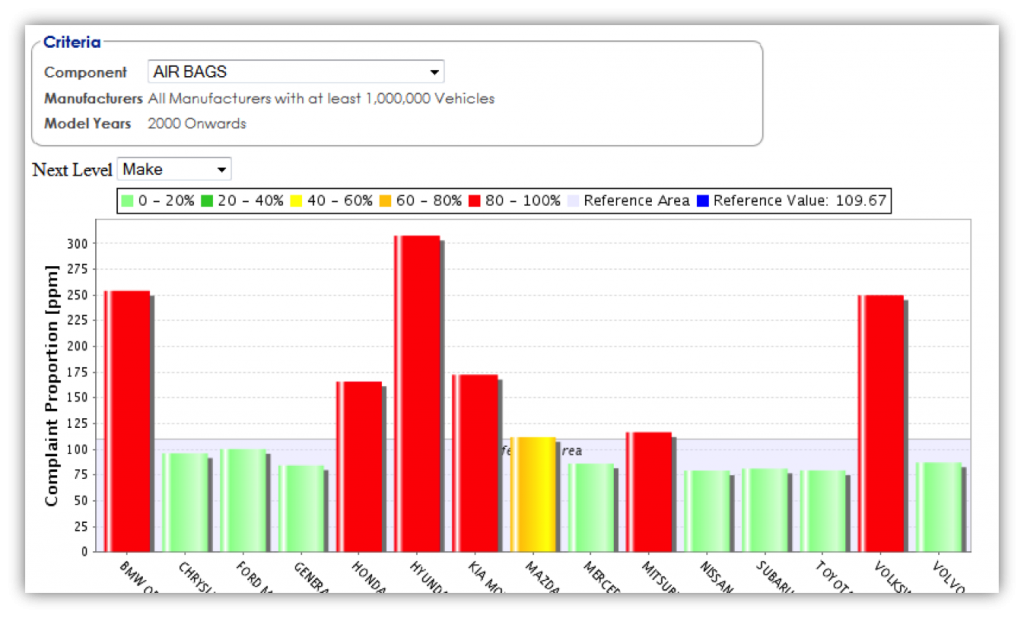
Datrato provides, in graphical format, the probability of having a proportion worse-than-average, from low to high. This makes it extremely easy and intuitive to perform a comparison against other manufacturers to see if any manufacturer, make or component has a probability worse-than-average or better-than-average.

Figure 2: Proportion Analysis Complaints vs. Manufacturers
Datrato allows users to perform the following kinds of proportion analysis as well:
- Complaints vs. Manufacturers
- Complaints vs. Makes
- Complaints vs. Model Years
Each chart offers the ability to drill down multiple levels. For example, a user can go from “Complaints vs. Manufacturers” to “Complaints vs. Makes,” and then to “Complaints vs. Models” for a specific component with a simple mouse click. This tool is extremely flexible and covers all possible scenarios for which the user wants to view and study the Proportion Analysis.
Complaint Rate Analysis
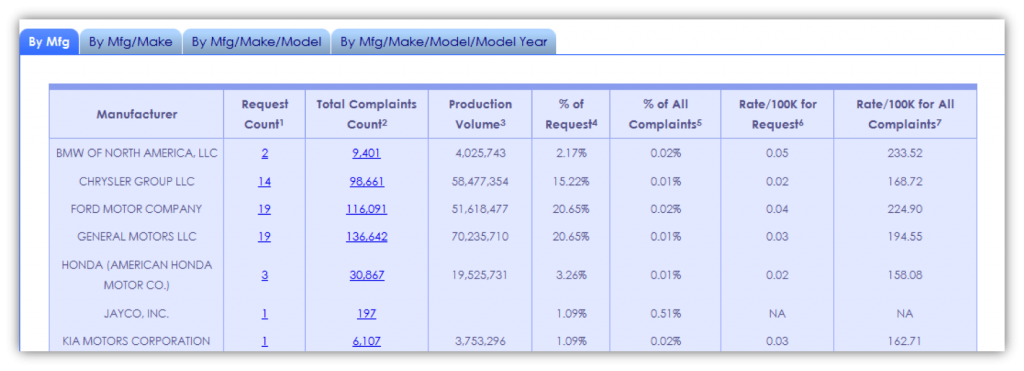
Complaint Rate Analysis is automatically performed by Datrato on every search that is performed. This analysis allows the user to compare the rate/100K at different levels.

Figure 3: Complaint Rate Analysis Report
The Percent Analysis Report is available for the following combinations:
- Manufacturer
- Manufacturer/Make
- Manufacturer/Make/Model
- Manufacturer/Make/Model/Model Year
In short, Datrato gathers rivers of data from multiple sources and presents them via one intuitive and flexible stream of intelligence.
Data. Delivery. Intelligence.

