Features
DATA
Datrato is a powerfully customizable system that allows users to integrate virtually any data source, or multiple data sources, whether they be internal or external to a given organization. Harnessing the strength of multiple “rivers” of information into a single stream of data intelligence—powered by an intuitive search engine—allows our clients to spend their precious time analyzing data instead of wasted time and resources searching for and collecting it.
 NHTSA Complaints
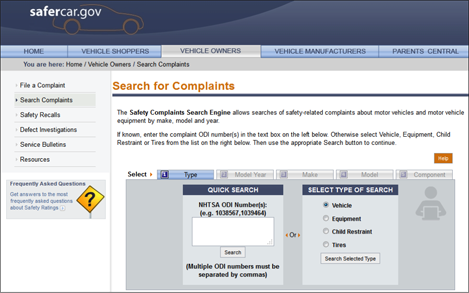 NHTSA Complaints
 NHTSA Investigations
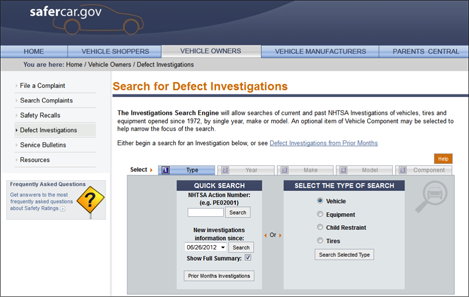 NHTSA Investigations
 NHTSA Recalls
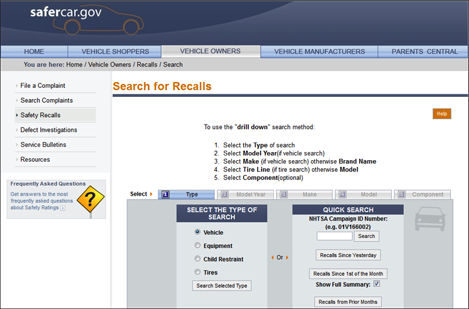 NHTSA Recalls
 NHTSA Early Warning Data
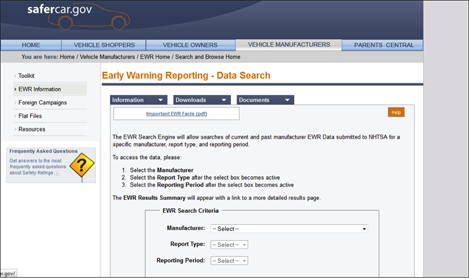 NHTSA Early Warning Data
 NHTSA Technical Service Bulletins
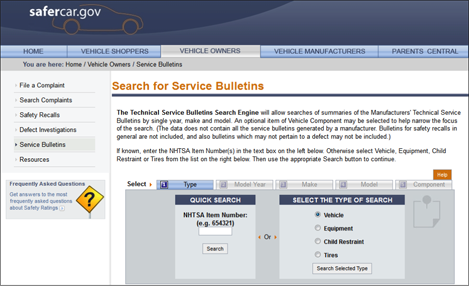 NHTSA Technical Service Bulletins
 Center for Auto Safety
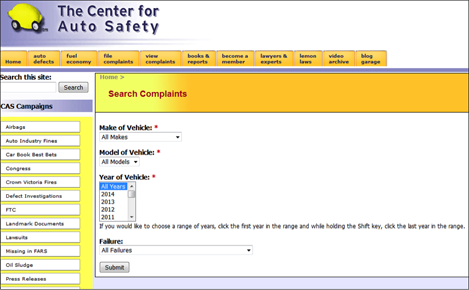 Center for Auto Safety
DELIVERY
Of course, data without presentation is hardly data at all. Via Datrato, information is delivered quickly and accurately to the user via a standard Web browser, presented in an easy-to-use and very powerful interface. Our clients are able to perform a single keyword search to access data from the multiple data streams integrated into the system. The data is provided instantaneously, and accessible in a variety of custom reports and viewing options. Regardless of the data sources, Datrato searches, sorts and provides a multitude of analysis solutions to dive deep into the abundance of information available.
Request Screen

This screen demonstrates how the search results are organized. All searches performed are automatically stored in the system and are displayed on a dashboard. Users can navigate multiple searches, review reports or perform additional actions on any of the previous searches (deeper keyword searches, additional parameters to sort the data to their needs, etc.).
Search Screen
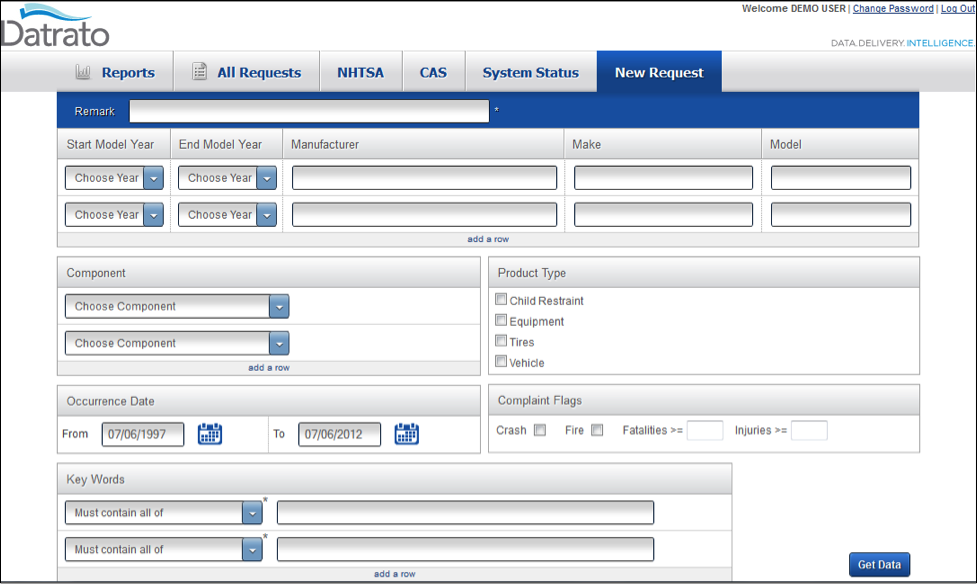
This screen demonstrates how a user can search for Complaints. Similar screens are available for Recalls, Investigations, Technical Service Bulletins, and Center for Auto Safety Search. The user can enter as much or as little information in the search screen and retrieve the results by clicking on “Get Data”. This function instantly sifts through the database and provides a detailed report, complete with highlighted keywords to allow for quick review and ease of comprehension.
INTELLIGENCE
Once a search is performed, the information is categorized and presented in multiple ways to make the data understandable for any level of user. From expert to layman, the easy-to-sort, search-and-scan reports allow users to get to what they need in a fast, efficient manner. Reports are quickly available to display statistical and analytical data. You’ve never gone from data to intelligence faster!
Statistical Tabular Report
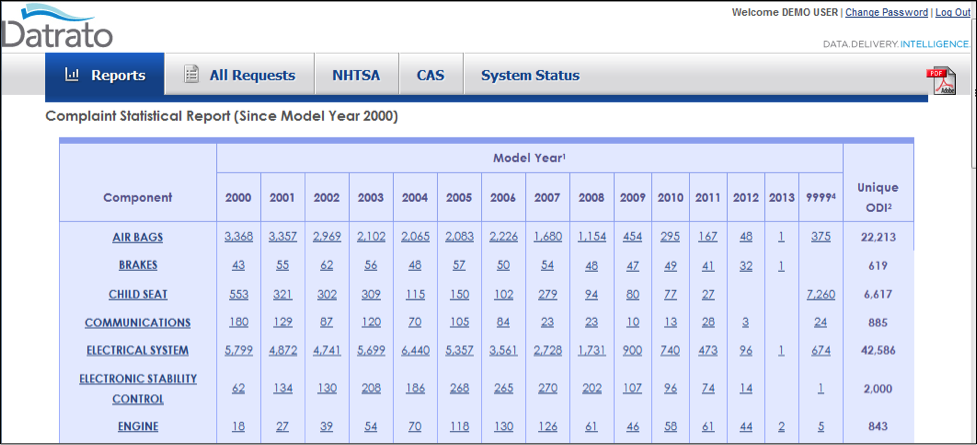
This screen demonstrates a tabular statistical report. This report is available for Complaints, Recalls and Investigations. The user can drill down by Components, then by Make/Model, and finally view the detailed report.
Statistical Graphical Report Complaints vs. Components
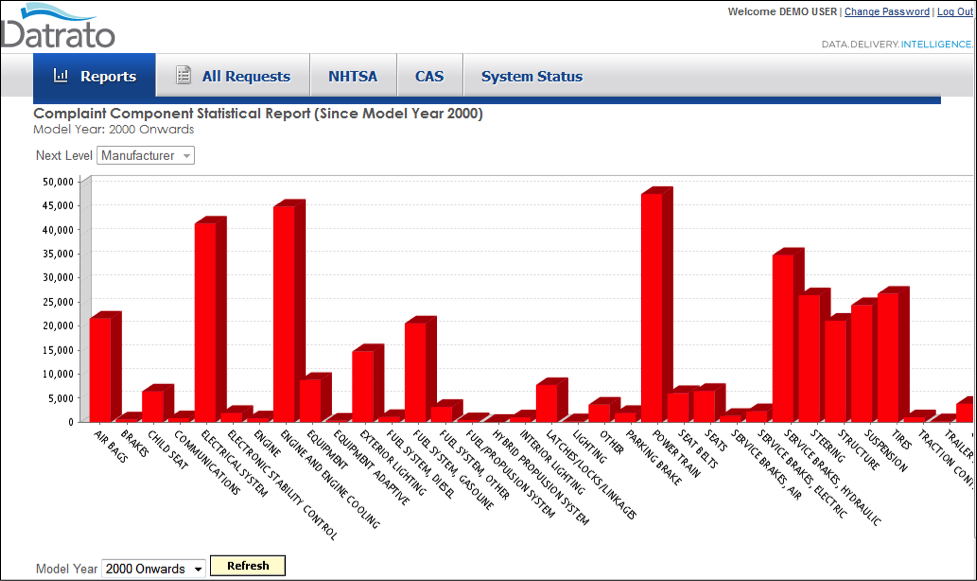
This screen demonstrates a report displaying graphical information of Complaints vs. Components. This report is available for Complaints, Recalls and Investigations. The user has the option of drill down to Manufacturer, Make, Model, and finally to a detailed report. The user also has the option to look at the data for any specific model year, or for all model years.
Statistical Graphical Report Complaints vs. Manufacturers
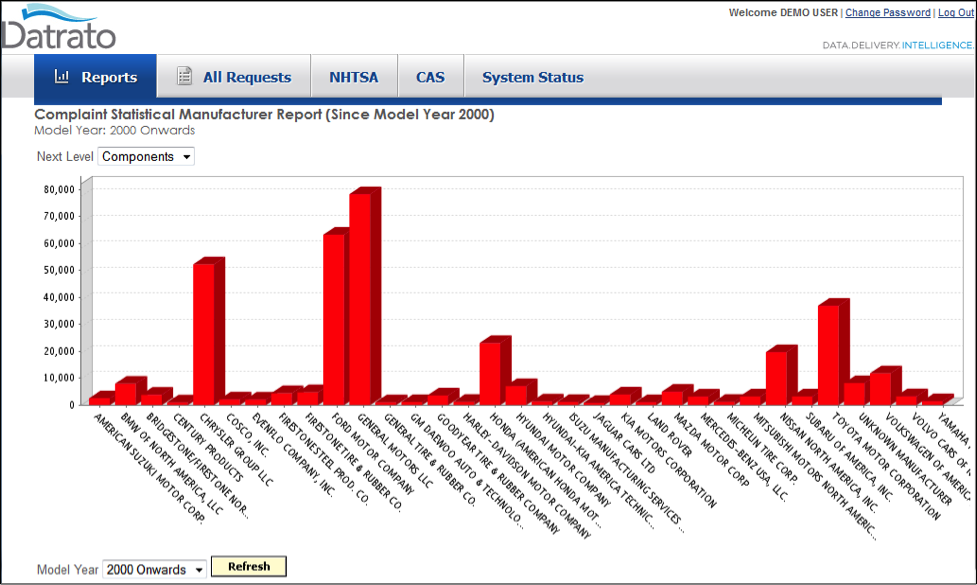
This screen demonstrates the display of the information graphically for Complaints vs. Manufacturers. This report is available for Complaints, Recalls and Investigations. The user has the option to drill down to Component, Make, Model, and finally to a detailed report. The user also has the option to look at the data for any specific model year, or for all model years.
Statistical Tabular Report for Individual Search
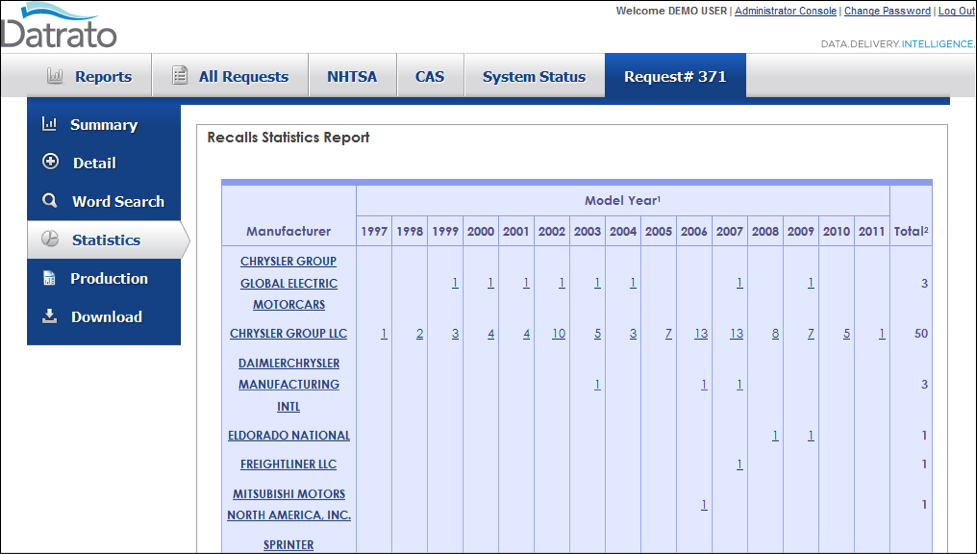
This screen is showing a Statistical Tabular Report of Distribution of Recalls for Manufacturers over Model Years. Similar reports are available for Investigations and Complaints. The user can drill down to Make, Model, and finally to a detailed report.
Statistical Graphical Report (Recalls vs. Manufacturer) for each Search
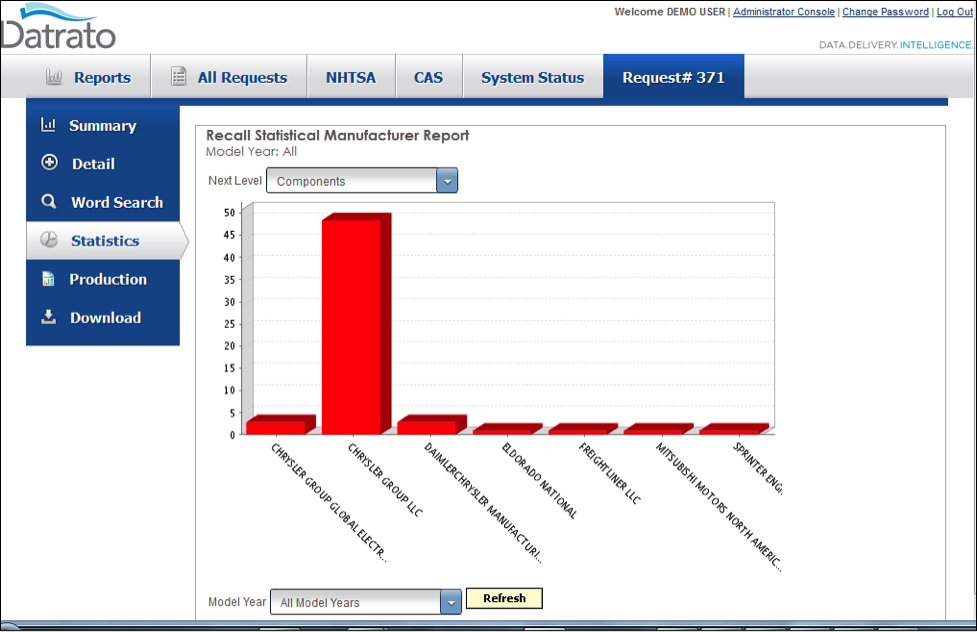
This report is demonstrating the graphical bar chart for Recalls vs. Manufacturers. A similar report is also available for Investigations and Complaints. The user has the option to drill down to Components, Make, Model, and finally to a detailed report.
Statistical Graphical Report (Recalls vs. Components) for each Search
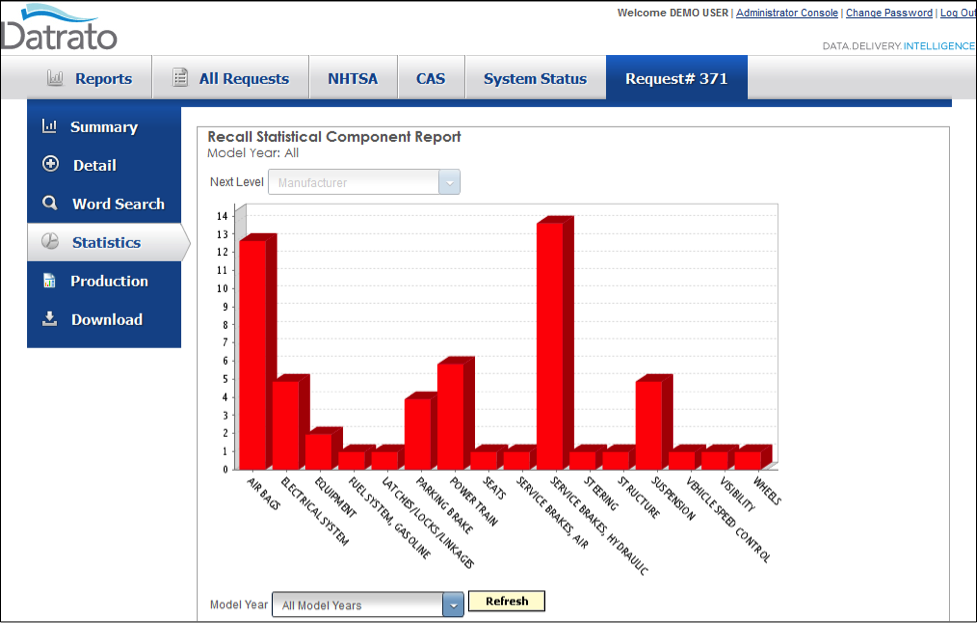
This report demonstrates Recalls vs. Components. Similar reports are available for Investigations and Complaints. The user can drill down to Manufacturer, Make, Model, and finally to a detailed report.
Complaint Rate Analysis
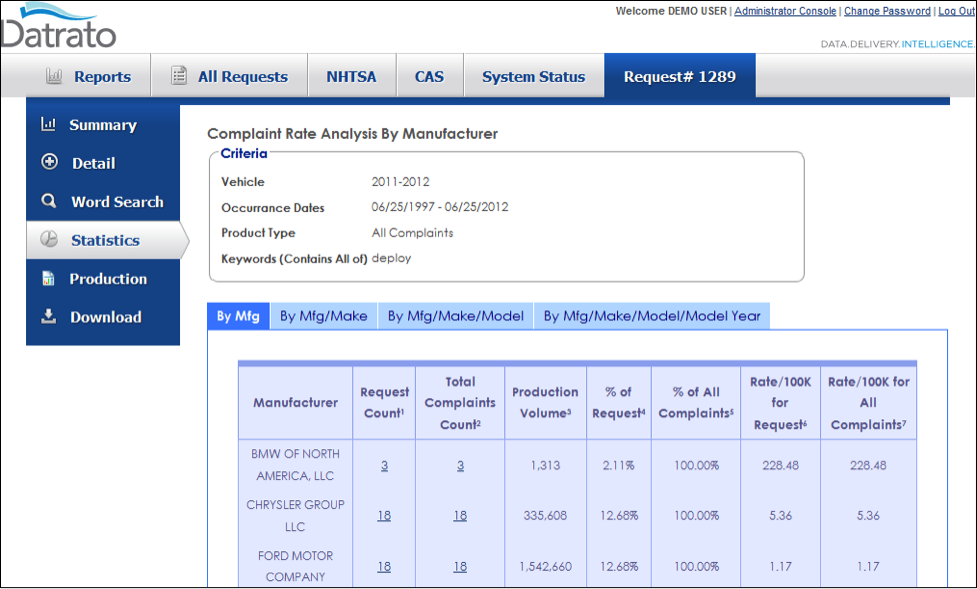
This report is showing the Complaint Rate Analysis. This demonstrates the comparison between various Manufacturers and Rate/100K. The comparison is available at following levels:
• Manufacturer
• Manufacturer/Make
• Manufacturer/Make/Model
• Manufacturer/Make/Model/Model Year
Proportion Analysis
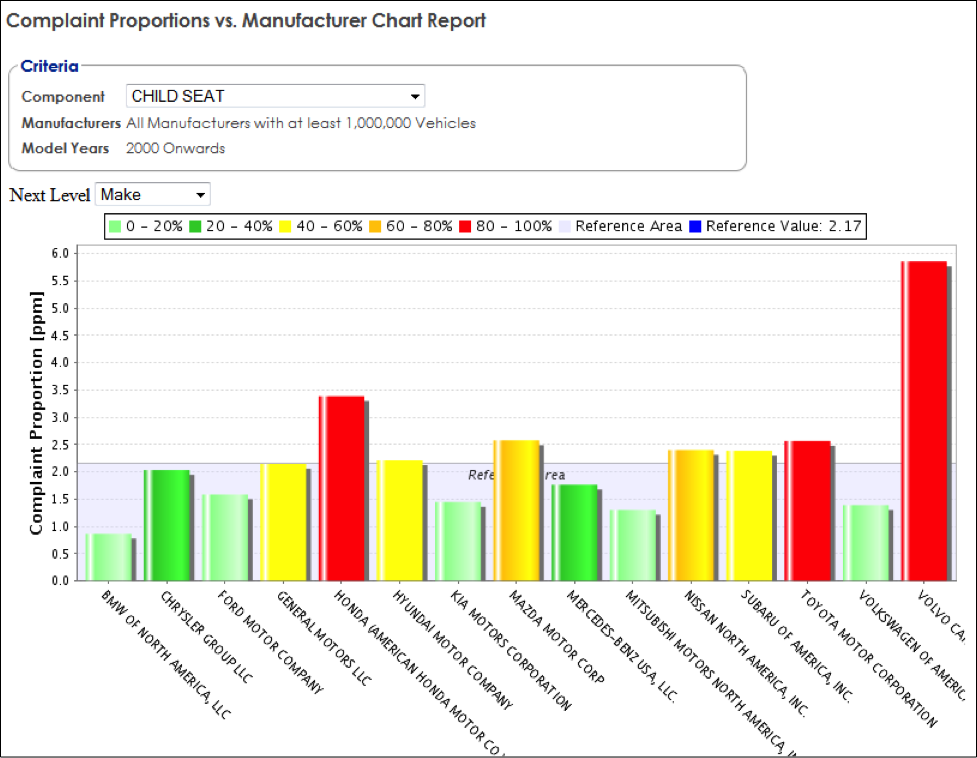
This report is showing a Proportion Analysis. This report evaluates on a probability basis, if the proportions of complaints measured on different make, models, components, etc., can be considered equivalent or significantly different. The user can dynamically perform the proportional analysis for any component, or across all components. The user can then view various levels across Manufacturer, Make, Model, or Model Year. In short, it allows the user to look at the information in any manner, by any dimension, and incredibly quickly and efficiently.

